


Urban Heat Island
What is an Urban Heat Island?
Urban heat island (UHI) refers to relative warmness of the urban areas compared to nearby rural areas. Heat islands occur especially during clear and calm evenings and nights. They can prevail despite the season and time of the day. Occasionally, however, temperature difference between urban and rural areas can be reversed and urban cold island (UCI) occurs. UCI is most common in daytime in summer, and the UCI intensity is often substantially lower than UHI intensity, which can be even 10˚C. The size of the city, building density, geographic location and layout affect the intensity of UHI. In general, the largest cities usually have also the strongest UHI intensities.
Factors contributing to the formation of UHI
- Anthropogenic heat release from (heated or cooled) buildings, traffic and industry
- Urban building materials such as concrete and asphalt store solar heat during daytime and release it during night. Urban materials have a high heat capacity, which enables heat to be stored in a thick layer.
- Evapotranspiration is lower in urban areas due to plenty of imperveous surfaces. The availability of water for evaporation is lower in urban areas where rainwater is gauged effectively away by sewers. Evapotranspiration cools down the surfaces and air, because the change of water from liquid state to vapor state requires energy. In other words, energy is transferred to latent heat instead of sensible heat. In cities where less evapotranspiration takes place, less energy is used in evaporation and more energy is available in the form of sensible heat, thus raising surface and air temperatures.
- Buildings trap air between them and reduce wind speed, especially at street level. Buildings also trap long-wave radiation in the street canyons and part of the radiation is reflected from building walls back to the street level.
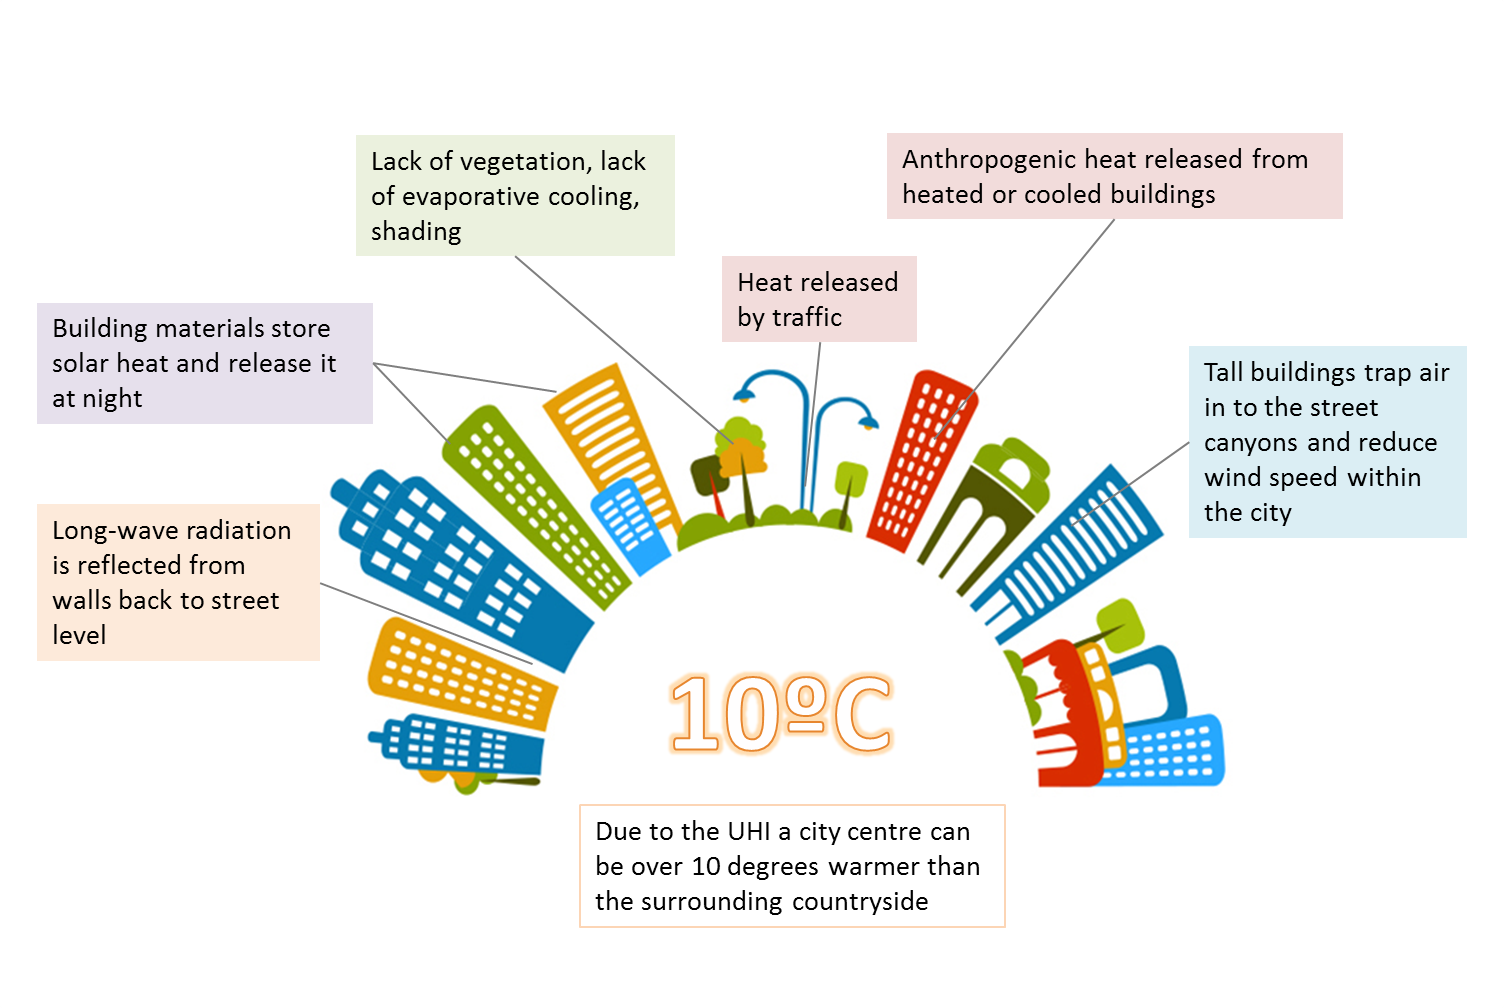
Figure 1. The main factors contributing to the formation of UHI
In general, typical urban construction materials and urban morphology slow down night-time cooling compared to rural areas, where stored or anthropogenic extra heat is not that much available, but stronger evaporative cooling takes place (figure1).
Effects of UHI on human health and energy consumption
Despite the negative effects of UHI are heavily concentrated in low latitude cities, the unfavourable UHI impacts are amplified during heatwaves also in high latitudes. High nocturnal temperatures increase heat stress and cause insomnia and dehydration. Most in risk are elderly people, young children and those who already have some disease. Summertime UHI often increases energy demand and results to power shortages in low latitude cities. High temperatures also increase the chemical reactions that promote the formation of harmful ground level ozone.
During winter, in high latitudes, the consequences of UHI are mostly positive, as less energy is needed for heating. In addition, UHI can be beneficial for sensitive plants.
How to mitigate?
There are many solutions, like cool roofing and cool building wall materials, that help to mitigate the UHI. Especially green roofs and walls can be beneficial along with new innovations within building sector. It should be noted that vegetated areas, like parks and green lawns, are among the most effective means to mitigate UHI. Therefore, not only the construction materials and urban morpohlogy, but also ’green planning’ is worth utilising when trying to address challenges caused by UHI.
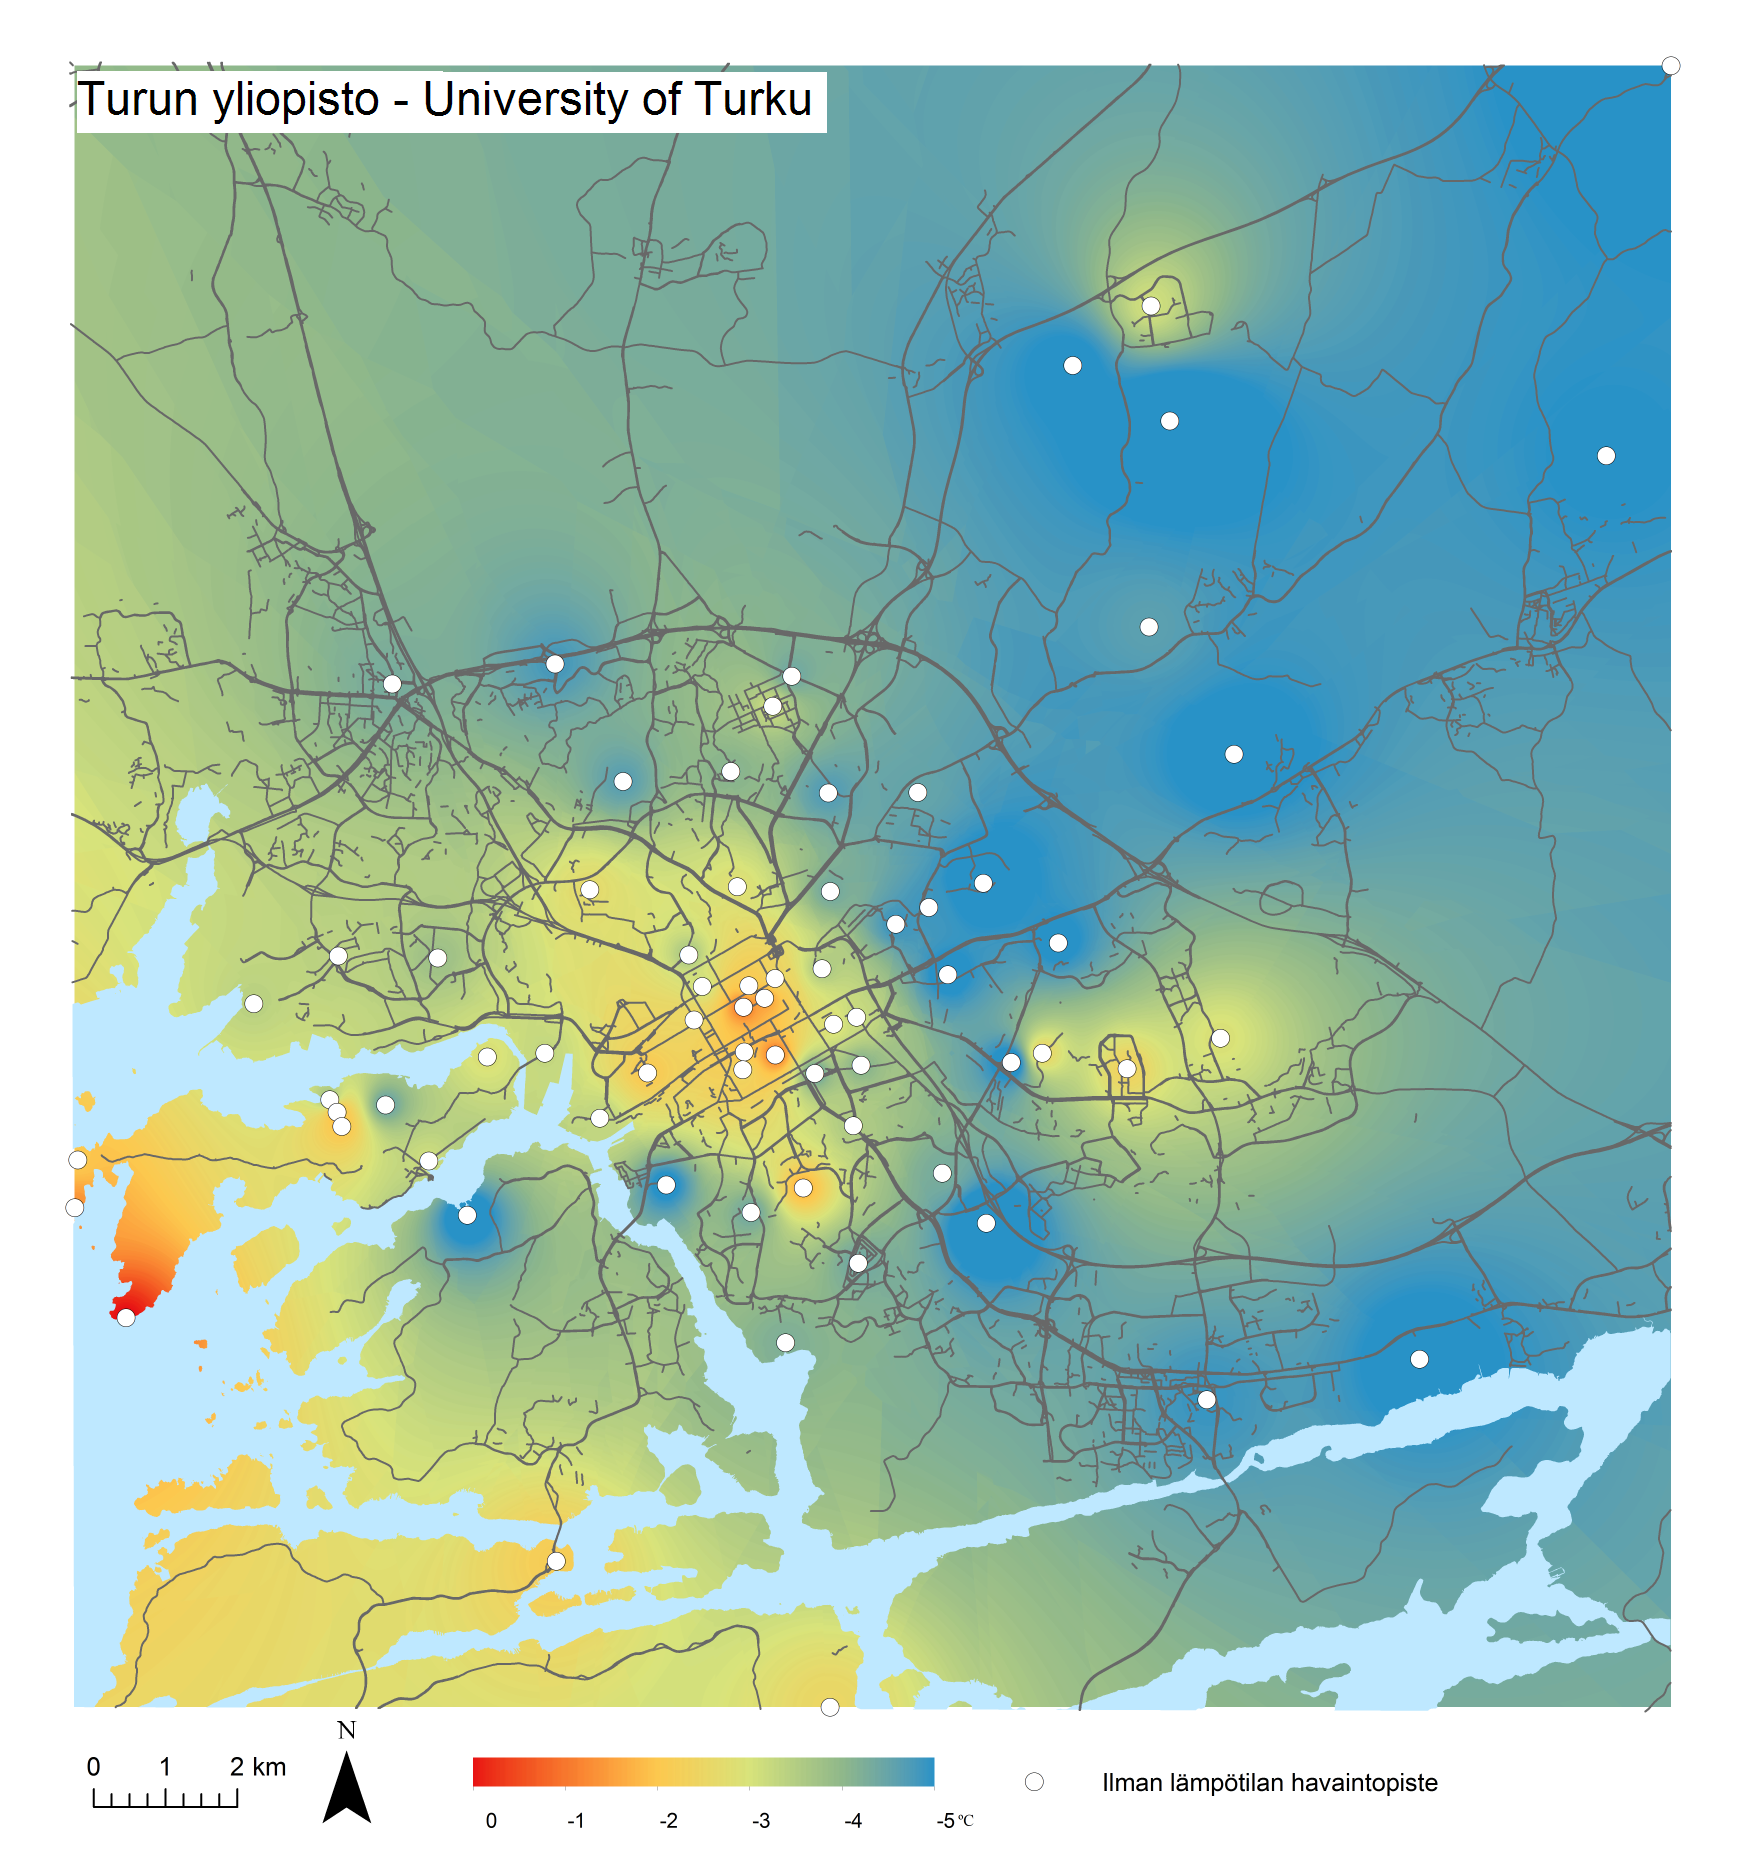
Figure 2. Air temperature in the Turku area between 21st and 22nd of October in 2013. Temperature map is interpolated from the TURCLIM temperature observations (white dots) The warmest areas are near the coast (still relatively warm sea surface temperatures) and city centre. Also some largest suburbs form small separete heat islands of their own.
The UHI research in the city of Turku
The TURCLIM (Turku Urban Climate Research Project) weather observation network maintained by the University of Turku and the Turku Environment and City Planning office has 75 temperature/relative humidity loggers within the city area (figure 2). The network has been operational since 2001, and the number of logging sites has slightly increased from original 60 during measurement period.
The current set of loggers measure air temperature and relative humidity at 30-minute interval. In order to reduce risk of possible vandalism loggers are attached to poles or lampposts at 3 m elevation, instead of 2 m elevation that is the standard for weather observations. Temperature loggers within the network are installed to various carefully selected urban and non-urban environments to cover broad range of effects of various environmental factors that control temperatures. The observation network records annually 1.4 million temperature and humidity observations.
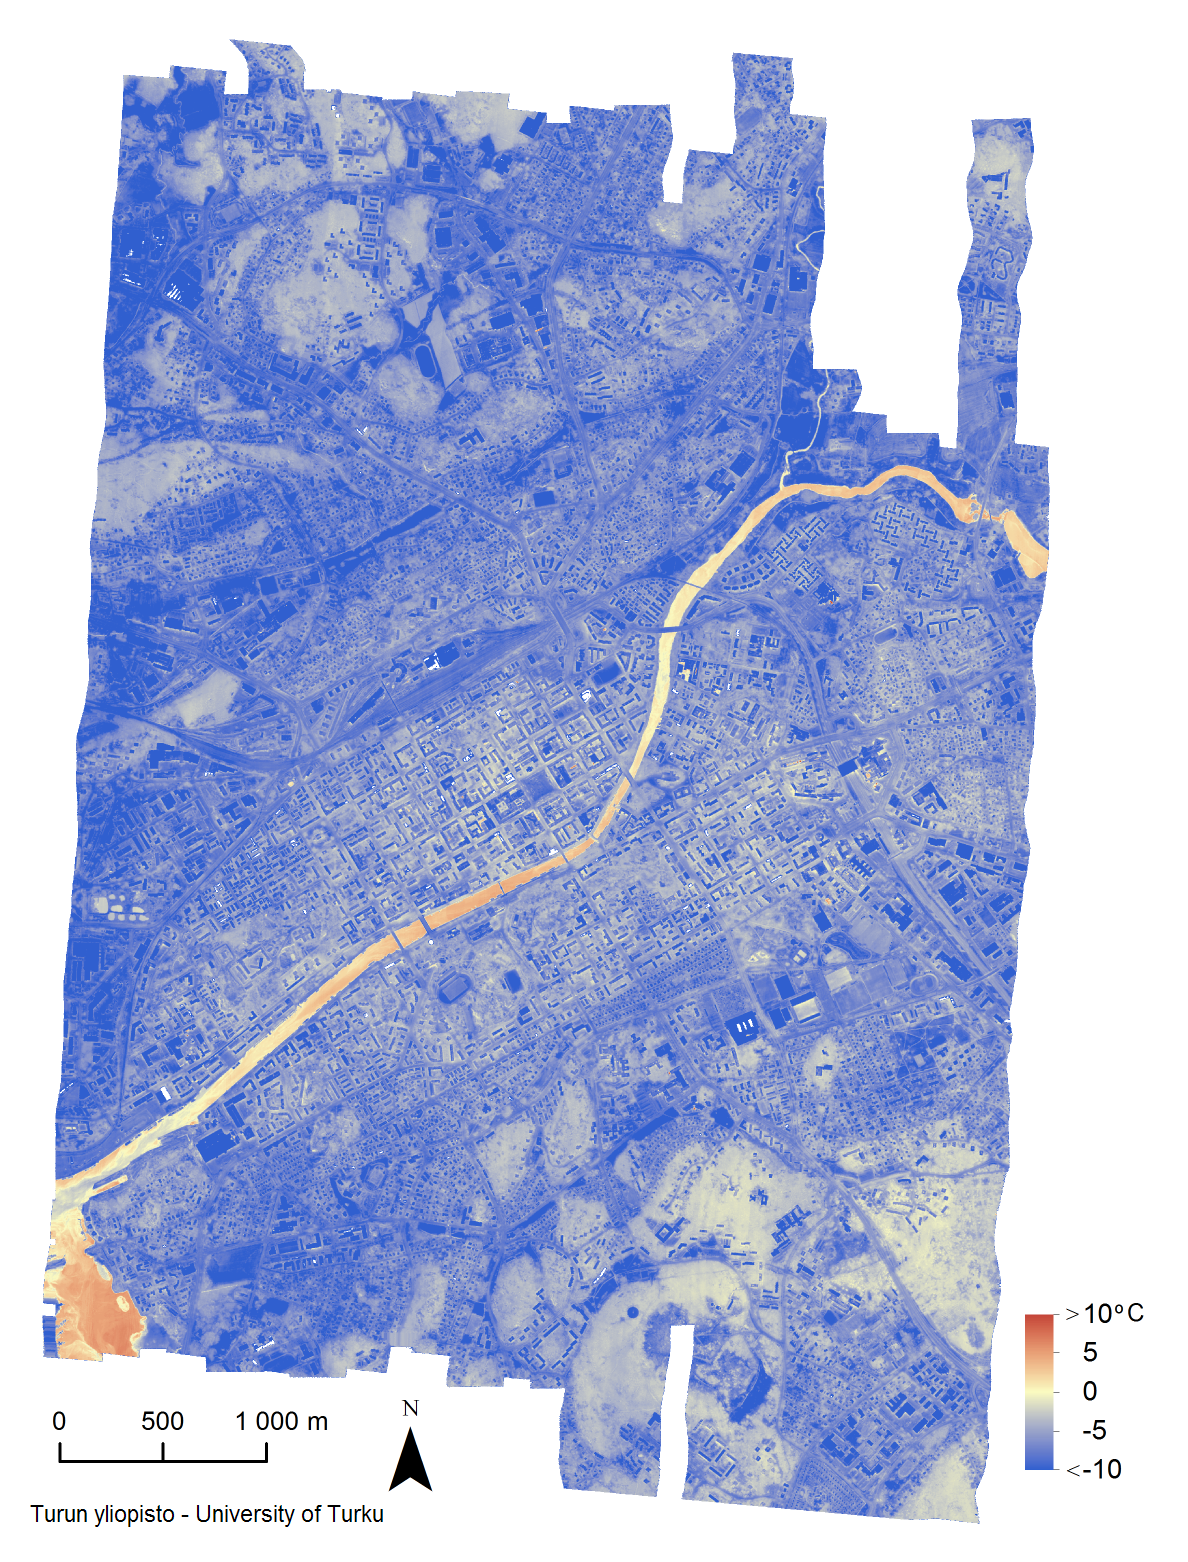
Figure 3. Visualised image mosaic from airborne hyperspectral imaging system. The image was acquired at night between 21st and 22nd of October in 2013. River Aura and coastal waters appear as the warmest surfaces along with heat emitting objects such as ventilation vents and heated surfaces.
Hyperspectral imaging of the city for ILKKA-project
As a part of ILKKA-project, an airborne hyperspectral imaging campaign with thermal infrared hyperspectral imaging system was implemented between 21st and 22nd of October in 2013 in Turku (figure 3). The main aim was to study the suitability of the methodology and airborne data in UHI analyses in the area. One example of the practical application was to identify possible heat leakages from buildings. The imaging system consisted of the airborne LWIR thermal hyperspectral imager AisaOWL by Specim.
The camera covered a contiguous spectral range from 7.6 to 12.5 μm in ~100 channels. During the imaging campaign a 25 km2 area was covered with 25 flight lines at altitude of 635 m. The ground resolution was 0.7 meters and a total flight line length was 137 km. Simultaneously, surface temperatures on different anthropogenic and natural surfaces were measured, and low atmospheric air temperature measurements were used as complementary reference temperature set. In order to detect the vertical temperature profile during the hyperspectral campaign, also 80 m high temperature measurement verticals were established.
REFERENCES
Arnfield, A. J. (2003). Two Decades of Urban Climate Research: A Review of Turbulence, Exchanges of Energy and Water, and The Urban Heat Island. International Journal of Climatology 23, 1–26.
Oke, T. R. (1987). Boundary Layer Climates, 2nd edition. 435 s. Routledge, London & New York
Suomi, J & Käyhkö, J. (2012). The impact of environmental factors on urban temperature variability in the coastal city of Turku, SW Finland. International Journal of Climatology 32: 451–463. DOI:10.1002/joc.2277
11.12.2014